


The Big Picture
A New York Times/Siena poll, released on Wednesday, has Minnesota political operatives and observers buzzing. The poll puts Peggy Flanagan ahead of Michele Tafoya by 14 points in Minnesota’s U.S. Senate race and Amy Klobuchar ahead of Lisa Demuth by 18 points for governor.
As excited as those numbers may make DFLers – and as hopeful as this DFLer is that they turn out to be true – those results should be taken with a grain of salt.
They sit well apart from several other recent polls. SurveyUSA and Mason-Dixon found Flanagan ahead by three and four points, respectively, in October. In the governor’s race, Morning Consult reported a nine-point Klobuchar advantage, while a Victory Insights poll commissioned by Tafoya’s campaign showed seven points. Different pollsters, dates and methods complicate comparisons, but the Times/Siena results present a notably stronger Democratic picture.
That does not automatically make the poll wrong. It does mean one survey should not become the basis for declaring either race settled.
With that caveat, there is a worthwhile question beneath the headlines: If this poll’s picture of Minnesota’s likely electorate is broadly accurate, what does it tell us about the coalition producing those leads?
The crosstabs offer some potential answers.
The DFL’s lead is anchored in a Twin Cities base that has barely moved since 2024, and it is growing in Greater Minnesota. Tafoya is running ahead of Trump, but she loses ground when voters think about prices, and much of her support is a vote against Flanagan rather than for her.
Where the DFL lead comes from and where it is growing
Two things stand out in the NYT/Siena poll’s regional numbers: the Twin Cities and surrounding suburbs supply most of the DFL’s lead, and Greater Minnesota is where that lead is growing.
Unsurprisingly, the Twin Cities deliver the poll’s most lopsided Democratic margins. Flanagan leads 87% to 7% in Minneapolis and St. Paul and Klobuchar leads 88% to 7%. In the “suburbs,” Flanagan leads 61% to 33% and Klobuchar leads 64% to 29%.
Notably, the suburbs are more than three times as large a share of the poll’s weighted electorate: 34%, compared with 11% for the Twin Cities. That changes how much each region contributes to the statewide result.
Each region’s contribution is its share of the weighted electorate multiplied by its candidate margin.
For Flanagan, that means multiplying her 28-point margin in the suburbs by the region’s electorate share (34%) produces approximately 9.5 percentage points of her statewide advantage. Applying the same formula, the Twin Cities contribute approximately 8.8 points to Flanagan’s lead. For Klobuchar, the suburban contribution is larger still: roughly 11.9 points, compared with 8.9 points from Minneapolis and St. Paul.
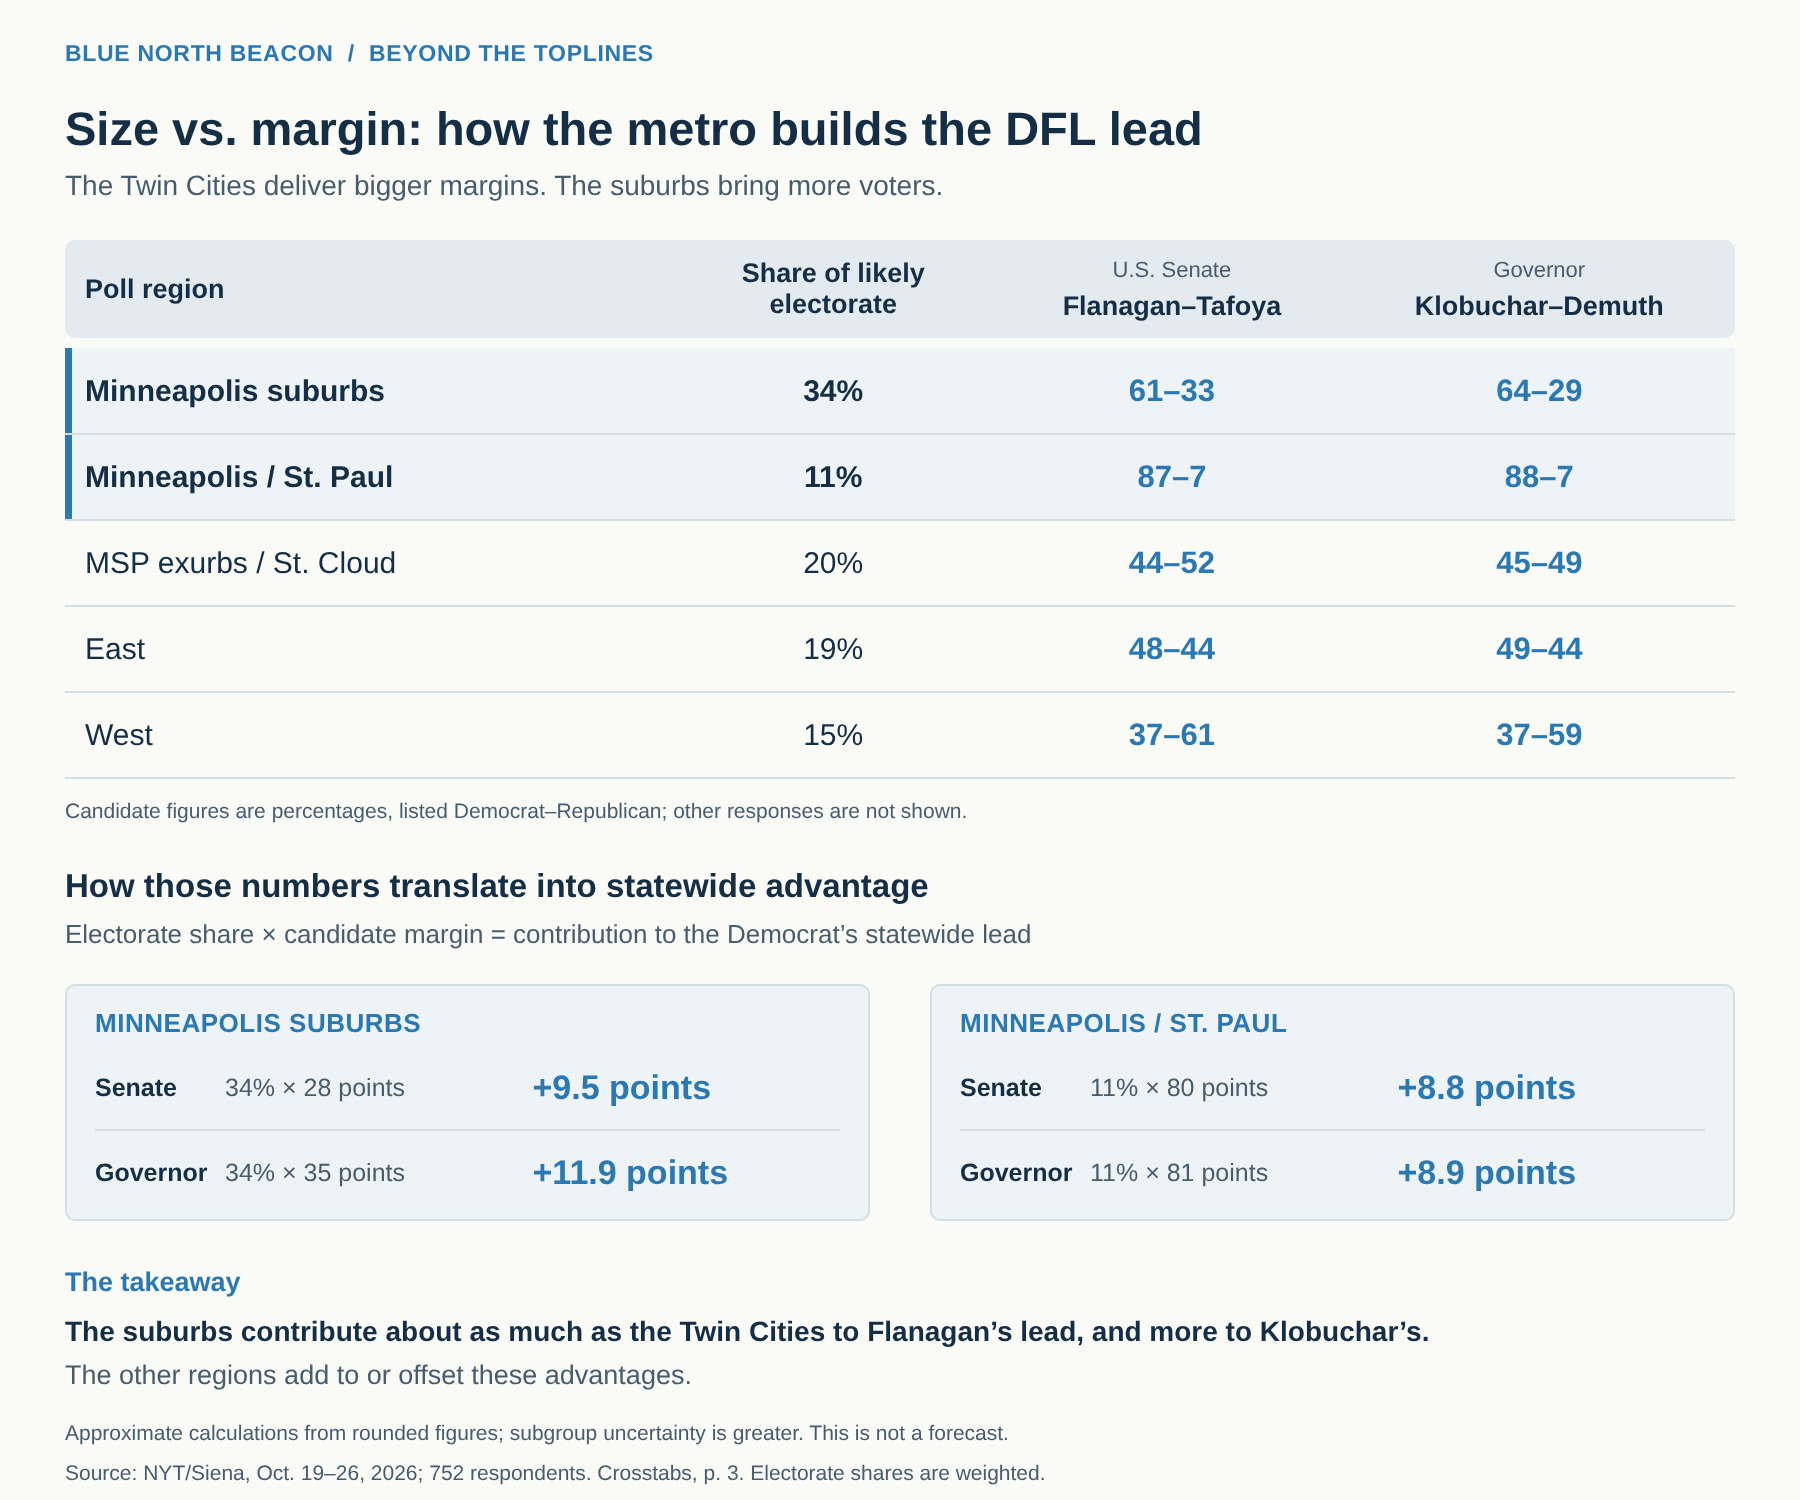
The five regions tested in the poll add up to Flanagan’s headline-grabbing statewide margin. Beyond the suburbs (+9.5 points) and the Twin Cities (+8.8), the East adds about 0.8 points to Flanagan’s lead, while the exurbs/St. Cloud (−1.6) and the West (−3.6) subtract from it. The net is her roughly 14 point statewide margin.
Size explains why the suburbs contribute so much, but not where Democrats are gaining.
Compared with how respondents say they voted in 2024, the metro has barely moved: suburban respondents backed Kamala Harris by 29 points and now favor Flanagan by 28. The change is clearer in Greater Minnesota. Respondents in the West backed Donald Trump by 35 points but favor Tafoya by only 24, and in the exurbs/St. Cloud region a 16-point Trump margin has become an eight-point Tafoya lead.
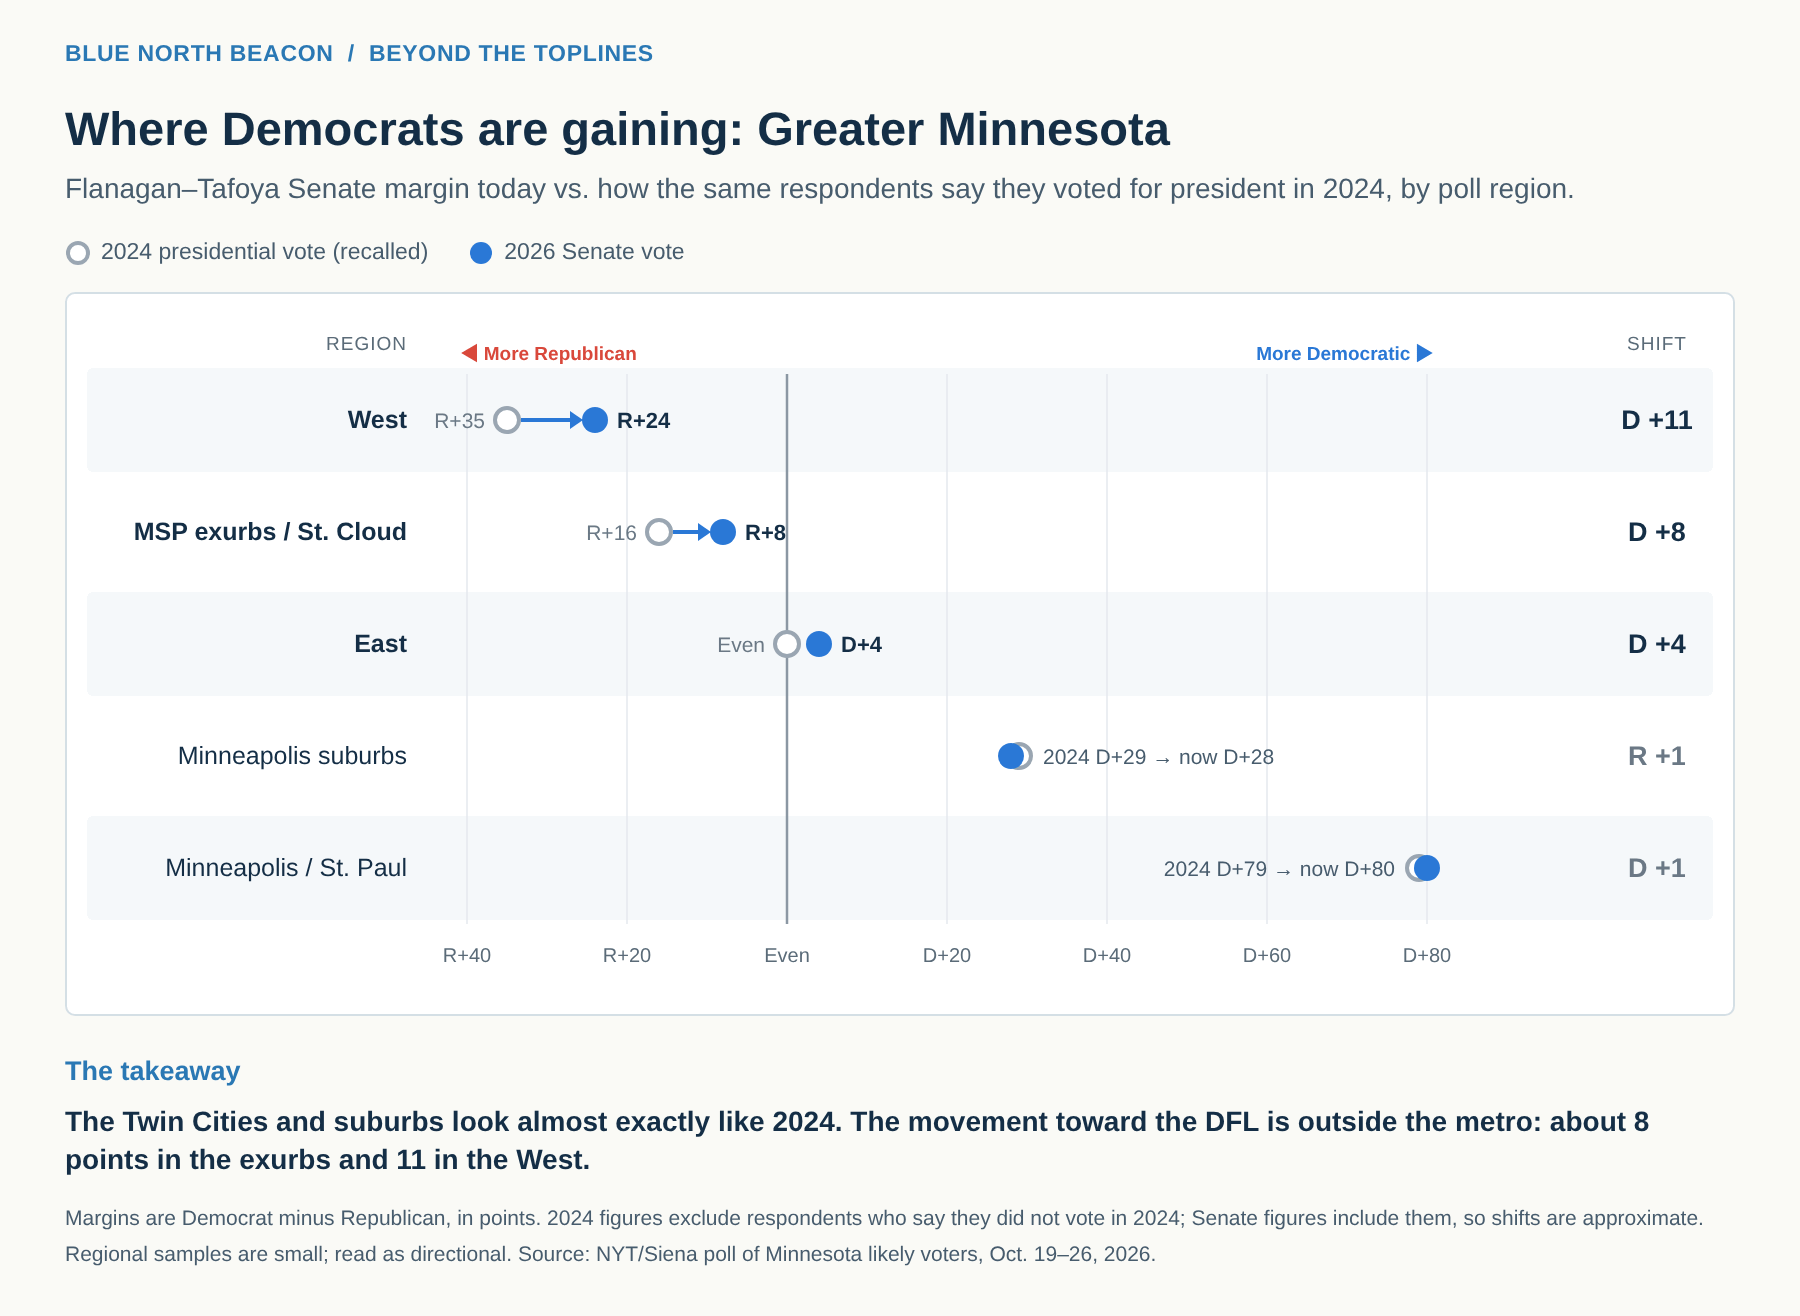
The statewide picture from this poll therefore has two parts. The metro supplies most of Flanagan’s lead, at roughly 2024 levels. Greater Minnesota supplies the movement.
Tafoya runs ahead of Trump
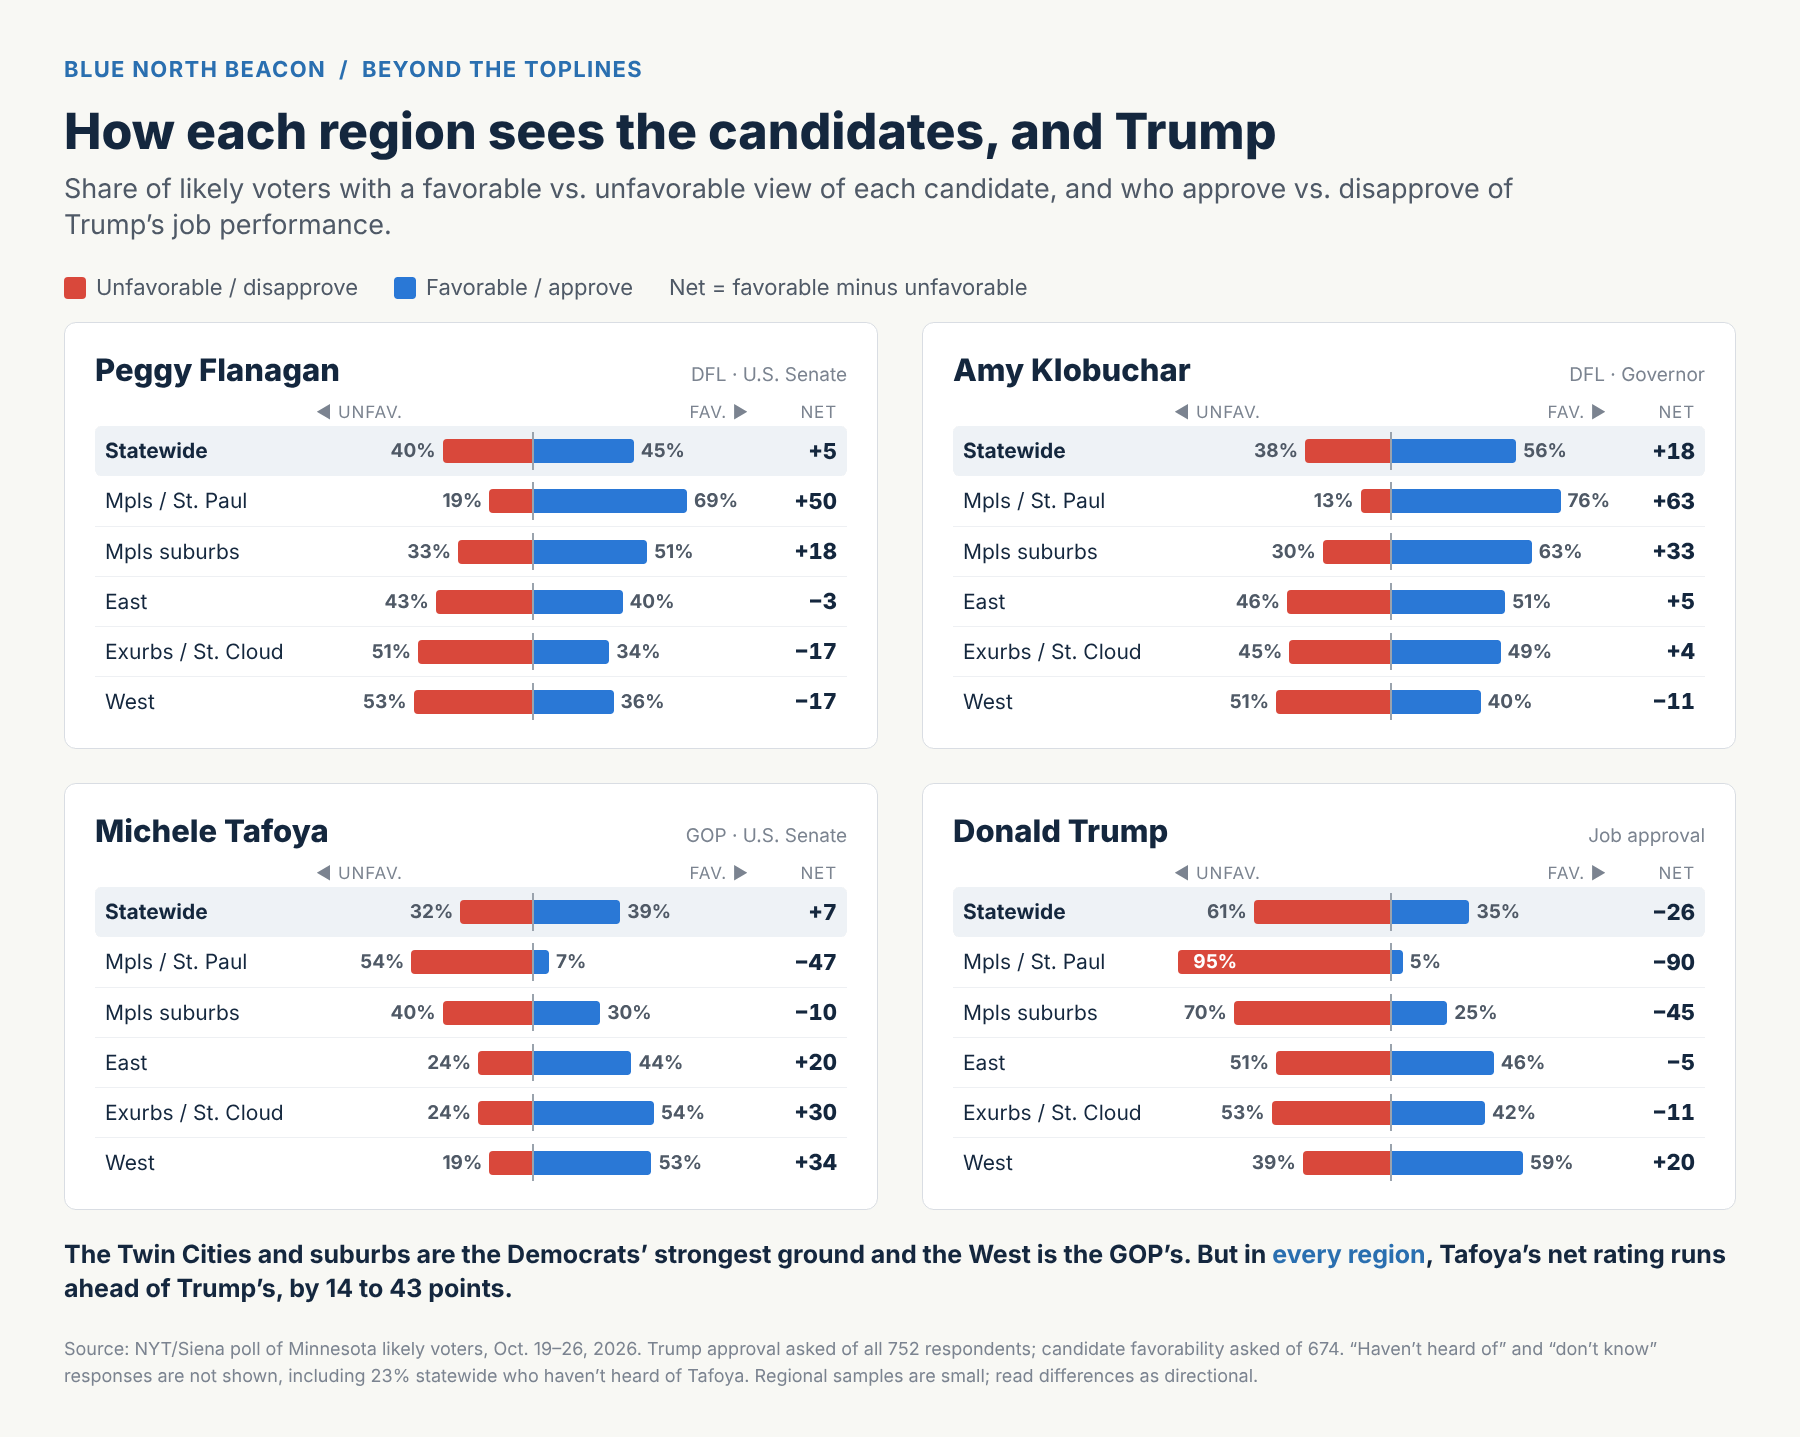
Trump’s numbers offer context for Democrats’ suburban strength in the poll.
Only 25% of suburban respondents approve of his performance, while 70% disapprove. Almost two-thirds—63%—strongly disapprove. That is a more hostile environment for the president than the statewide result, which puts his approval at 35% and disapproval at 61%.
The opposition is not equally strong everywhere. Among white voters without a college degree, Trump’s approval and disapproval are tied at 49%.
Tafoya, meanwhile, runs ahead of Trump’s approval statewide and in most regions.
Statewide, she wins 40% while his approval sits at 35%. In the suburbs, she wins 33% to his 25% approval. In the exurbs/St. Cloud region, his approval is 42%, but she wins 52%. And among white voters without a degree, where his approval is split evenly, she leads Flanagan 52% to 44%.
That gap matters. Trump’s unpopularity is shaping the environment, but it is not fully weighing Tafoya down, especially outside the metro, where her support extends beyond his own.
The poll does not overwhelmingly establish that disapproval of Trump caused a particular Senate or governor choice. But it shows the political environment in which those choices are being made.
“The economy” and “cost of living” tell different stories
The Senate questions reveal a complication beneath Flanagan’s statewide lead.
Asked which candidate would do a better job on “the economy,” respondents choose Flanagan over Tafoya by 48% to 44%. Asked about “the cost of living,” the result is 53% to 37%.
The contrast is especially striking among respondents without a bachelor’s degree. Tafoya leads 52% to 42% on the economy; Flanagan leads 48% to 39% on cost of living.
The pattern is notable because the difference comes mostly from Tafoya losing ground, not Flanagan gaining it. Statewide, Tafoya falls from 44% on the economy to 37% on cost of living, while Flanagan rises from 48% to 53%. In the exurbs/St. Cloud region, Tafoya drops from 64% to 48%; in the West, from 61% to 45%, with 21% unsure.
It is important to highlight a polling methodology note here. In the poll, the “economy” question went to 329 respondents; while the “cost-of-living” question went to a separate group of 345. The corresponding groups without bachelor’s degrees contained 152 and 143 respondents. That distinction matters. These are not the same voters changing their answers when the wording changes. Differences between the samples, along with sampling uncertainty, could explain part of the contrast.**
Still, the results raise a useful question: Do voters who trust Tafoya on broad economic management hesitate to credit her on the practical challenge of affording everyday life?
For Tafoya, Trump is a drag and Flanagan is the motivator
Opposition to Trump is part of the environment, but the reasons voters give for their Senate choices add another layer. Most strikingly, Tafoya voters are twice as motivated by negative views of Flanagan as Flanagan voters are motivated by negative views of Tafoya.
Among Flanagan supporters, 24% name support for a political party as their main reason. Another 21% cite a positive view of her character or competence, and 19% cite her policies.
Tafoya supporters give a different mix of answers. Their most common response, at 36%, is a negative view of Flanagan’s character or competence. Positive views of Tafoya’s policies follow at 21%; party support accounts for 12%, and positive assessments of her character or competence account for 11%.
Grouped together, negative reasons—a negative view of the opponent’s character or policies, or a vote against the other party—account for about 46% of Tafoya’s support. For Flanagan, the comparable figure is about 22%.
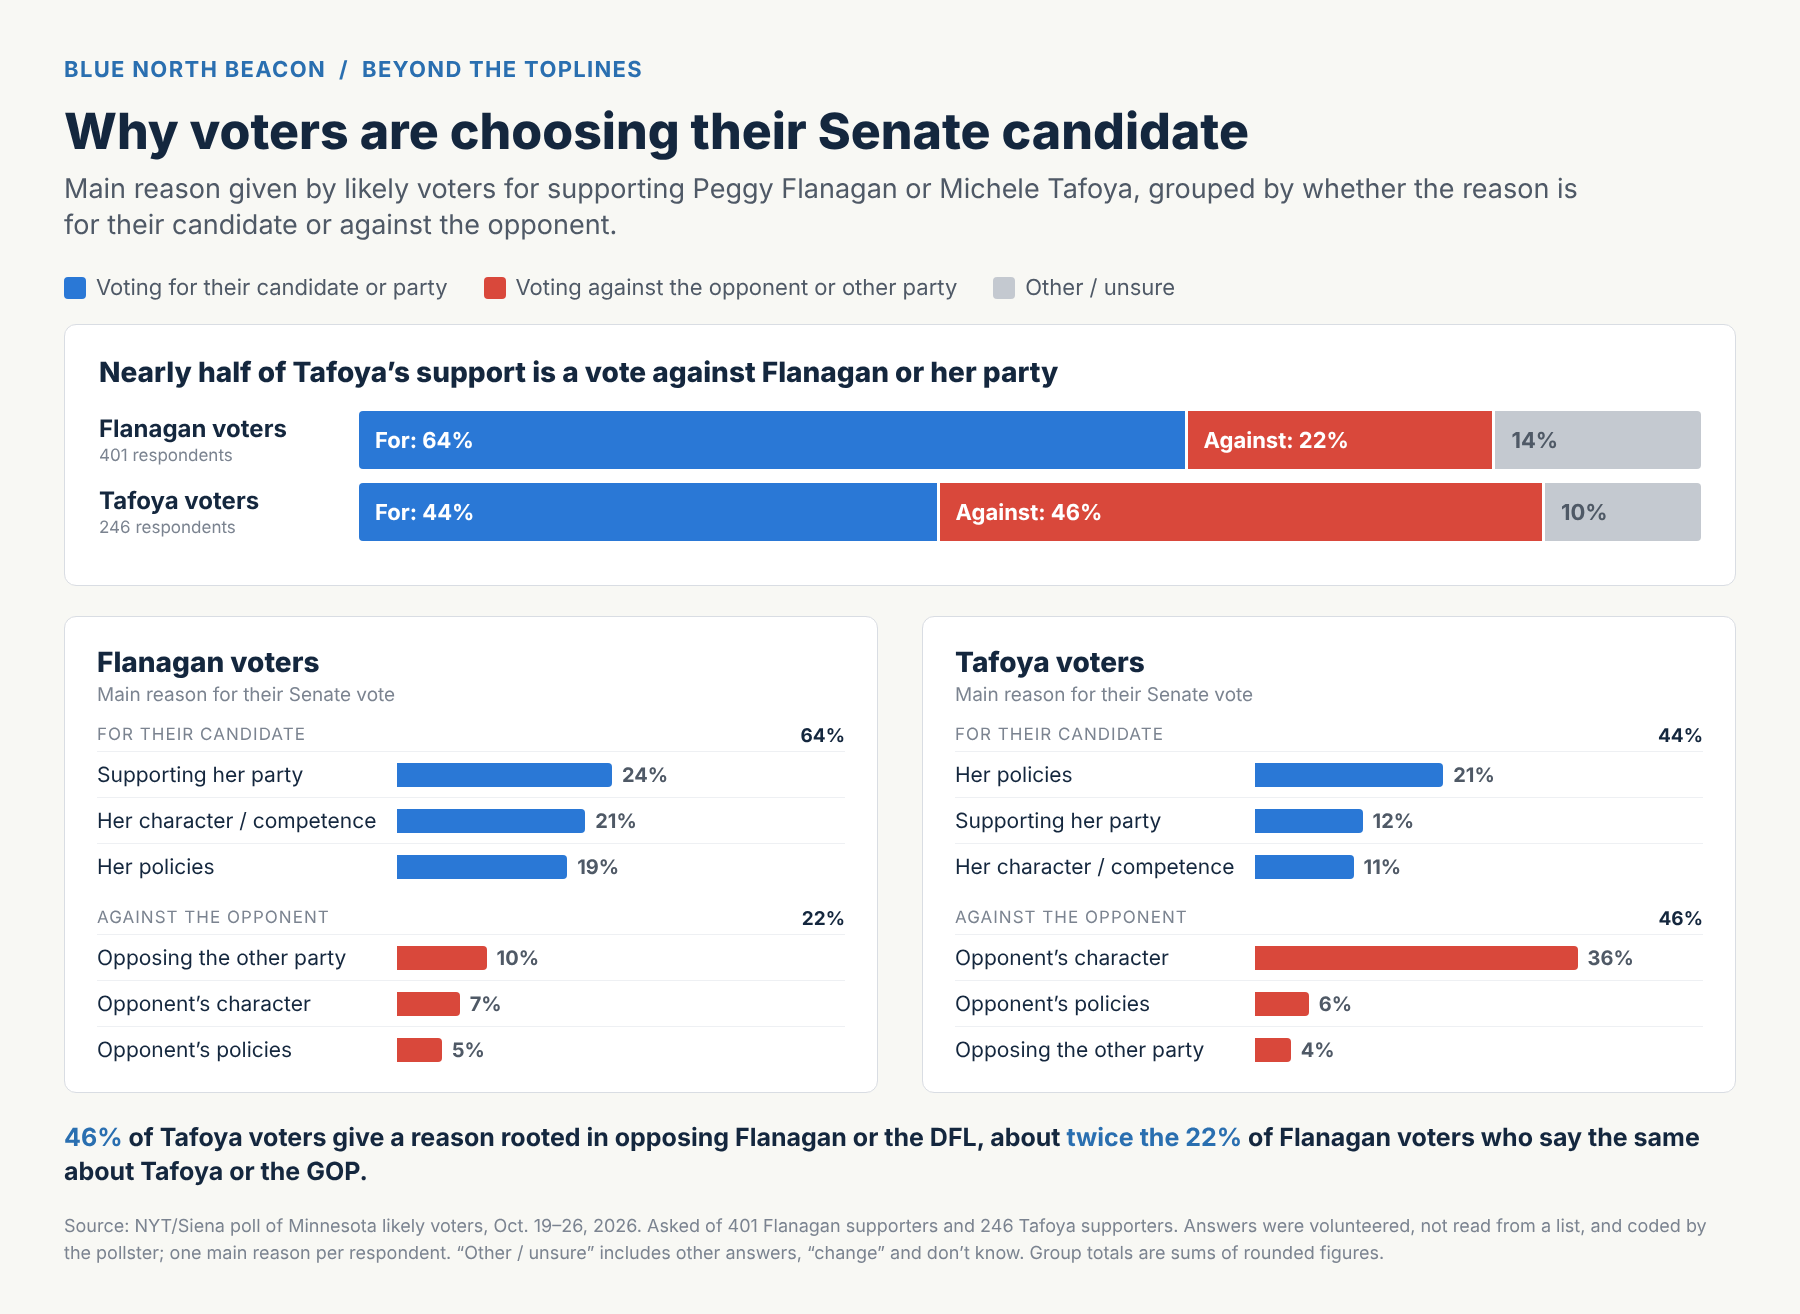
The answers were volunteered by respondents rather than chosen from a list, and the question asks for one main reason, so it cannot capture every consideration behind a vote.However, those results do show that the same ballot choice can reflect different motivations.
Flanagan’s support includes party loyalty and affirmative judgments about her while Tafoya’s support includes policy agreement and a substantial concentration of opposition to her opponent.
In other words, for a large share of Tafoya’s supporters, this race is less about Tafoya than about Flanagan.
Bottom Line
The NYT/Siena poll’s large Democratic leads should be weighed alongside the closer races reported by other surveys. Looking beneath those leads does not eliminate that uncertainty.
What it does offer is a more detailed picture to test.
If the poll is right, the DFL’s lead rests on a metro base that looks much as it did in 2024, plus real movement toward Democrats in Greater Minnesota. Tafoya is running ahead of Trump, but much of her support is a vote against Flanagan, and her standing on the economy weakens when the question turns to prices.
On election night, two results will show whether that picture holds: whether the exurbs and western Minnesota move toward Democrats compared with 2024, and whether the suburbs hold at their 2024 margins.
If both happen, the Times/Siena numbers will look less like an outlier than they do today.
**A note on the numbers: The full NYT/Siena poll of 752 likely voters has a margin of error of plus or minus 4.1 percentage points, and the Times reports that its real-world error from 2016 to 2024 was plus or minus 5.6 points at the 95th percentile. Regions, age groups and other subgroups are smaller, with wider margins, so the figures below are best read as directional. Calculations in this piece use rounded poll figures and are not BNB forecasts of next Tuesday’s results.**